
Global monetary policy has evolved drastically over the last century. At the start of the 20th century, the global monetary system relied on gold as the de-facto standard. At Bretton Woods, global powers agreed to a system of fixed exchange rates wherein each currency’s value was fixed in terms of US dollars, and the US dollars value in turn was fixed in terms of gold.1 This system established the dominance of the US dollar in global trade and as a reserve currency.
Given the dominance of the US dollar, as well its centrality to international trade, finance, and depth2, US monetary policy action bears a huge impact on economies across the world. This effect is particularly pronounced in emerging economies, given their reliance on funding from dollar credit markets. Changes in US monetary policy thus cause fluctuations in several macroeconomics indicators, such as domestic interest rates, interest rate spreads, currency exchange rates, inflation, and foreign investments.
In June 2004, a year after having lowered the Fed funds target rate to 1%, the US had witnessed an entire year of average inflation at 2.1%, and the Fed started a cycle of steep interest rate hikes, increasing the Fed funds target rate to from 1% at the start of June 2004 to 5.25% percent at the end of June 2006 – process carried out over 17 rate hikes. Thereafter, starting July 2007, taking cognizance of the tumult in the credit markets, the Fed initially lowered its discount rate, and in the 15 months from September 2007 till December 2008, cut its funds target rate to 0.125% – a lifetime low. This started an extended period of low interest rates, quantitative easing, and general support measures to cushion the impact of the global financial crisis. After a period of gradual, sustained recovery, the Fed announced in June 2013 its plans to reduce the pace of asset purchases, and over a period, return the funds target rate to normal levels.3
This led to a panic among emerging markets investors, and emerging markets witnessed heavy outflow of foreign capital, and their currencies fell to record low levels. While the Fragile Five group of countries, namely India, Brazil, Turkey, South Africa and Indonesia, were the first to feel the impact given their reliance on foreign capital, the impact spread to other emerging economies as well.4 Indeed, the impact on the these economies was reflected on their currencies – the Brazilian Real (“BRL”) and the Indian Rupee (“INR”) had depreciated by 12% and 15% over a mere span of 2 months post the Fed’s June announcement, respectively. The Turkish Lira (“TRY”) ended the year down by ~10%.
Given the post-COVID-19 liquidity that was pumped up across global markets, and the November 2021 Fed announcement authorising lower asset purchases and that officials were ready to raise rates sooner than than expected5 was anytime in the coming. The anticipation was made real on May 4, 2022, when the Fed raised the funds target rate by 40bps, triggering a set of reactions that could lead to a situation similar to the ‘near-crisis’ of 2013 for emerging economies.
First, let’s observe the following macroeconomic factors for the economies, and compare the situation of 2022 with that of 2013:
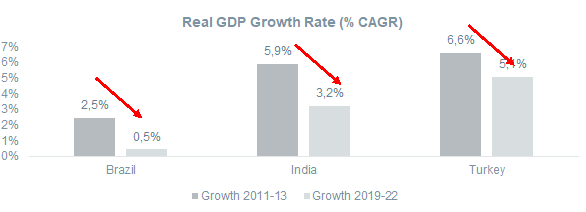
Real GDP growth for the period 2019-22 for countries observed was considerably lower than for the period 2011-13. While the overarching impact of COVID-19 induced disruptions in trade across the globe have been observed in all countries, each of the countries of interest have experienced idiosyncratic events and policies that have impacted growth. There is a pickup in growth after the COVID-19 induced slowdown, though the growth is materially lower than what it was in 2013.

In the period of 2012-14, there was a general reduction in the policy rates prior to the announcement by the US Fed in June 2013. And after the announcement, the global markets became jittery and triggered a rush of funds out of emerging markets across the world in favour of safer, developed market assets. This led to policy response of higher policy rates in the year following the Fed’s announcement. In the lead up to 2022, again the broad trend was towards easy monetary policy across the countries (in response to the COVID-19 pandemic). Hence, most countries were at or near all-time lows in terms of policy rates in the period of Jun-20.

Inflation scenarios differ across the three countries. While in Brazil inflation rate has increased marginally from 5.8% over 2011-13 to 6.6% over 2019-22, India’s inflation has decreased from 9.7% over 2011-13 to 5.9% over 2019-22. In Turkey’s case, inflation has skyrocketed from 8.2% over 2011-13 to 29.2% over 2019-22. In Brazil, inflation has risen amid high commodity prices and currency depreciation. In Turkey, the situation has been quite precarious with significant dollarization of reserves, as the confidence in central bank policy has been eroded with persistently high inflation.

The government net debt as a percentage of GDP has increased for all the three countries. Further, as all three countries are traditionally net importers i.e., operate a current account deficit, a reliance is debt can be expected. So, in terms of vulnerability to US monetary policy shocks, our subject economies are subject to risks given their high level of indebtedness, and adverse changes in interest rates can limit their ability to renew their debt obligations at favourable terms, and in extreme cases, inhibit their ability to repay foreign creditors.

The foreign exchange reserves to GDP at Brazil and India have increased significantly in 2021 as compared to 2013, while there is not material difference for Turkey’s foreign exchange reserves to GDP.
Foreign exchange reserves is a key factor of stability for an economy in terms of its ability to bear external monetary policy shocks in that they provide ability to undertake currency market intervention as well as necessary medium for imports.

The above chart presents the change in currency rate vis-à-vis the dollar. For 2013, the change in currency value captured is the maximum chance since the Fed announcement on June 28, 2013 and for 2022, the same metric has been captured after May 4, 2022 hike in interest rate.

In 2013, upon the Fed’s announcement, it is noted that across Brazil, India and Turkey, the Manufacturing PMI indicated contraction in the manufacturing sector, though with minor lag. Due to the Fed’s announcement in June, the contraction is indicated by PMI, and the accompanying flight of capital from emerging markets (though Brazil was a significant exception experiencing strong FPI inflows despite negative manufacturing PMI).
However, in 2022, despite the increase in fed funds rate target, the PMI has indicated expansion in the months since May 2022. This suggests a lot more buoyant economic activity and general trade sentiment within the manufacturing sector, both on a standalone basis, and especially when compared to the study period in 2013.


While both post-announcements 2013 and 2022 were periods of FPI withdrawals, especially for India, one aspect which has bid well for India in 2022 is how the size of its financial market has grown.
A lower market cap to GDP ratio could alternatively lead to the precipitous cycle of higher US interest rates leading to FPI withdrawals, which would in turn put pressure on both the exchange rate as well as the capital market. Rupee depreciation would worry investors of a double whammy in terms depreciation in the value of their investment as well as the currency, and thus prompt more withdrawals. Thus, a higher market cap to GDP suggests significant investor interest, and especially when coupled with domestic investor participation, cushions the market cap impact of FPI outflows, and thus stops the vicious cycle of FPI withdrawals, capital market and currency value fall.
The global reaction and response to Fed rate hike / announcement in 2022 was distinct from that in 2013. The 2013 announcement was sufficient to send the world into shockwaves, with emerging markets suffering from the withdrawal of foreign capital towards safer assets, putting enormous pressure on their respective currencies as well as policy tools. Countries particularly dependant on foreign capital were particularly hit with clear negative sentiment as demonstrated by the contracting manufacturing PMI across India, Turkey and Brazil. The effect was further visible in the impact on exchange rate, which depreciated in the range of 11-15% for all three economies, and in fact within a span of 2 months for Brazil and India.
However, the situation in 2022 has some similarities and some contrasting situations in comparison to 2013. While GDP growth and debt to GDP ratio have worsened, reserves to GDP ratio have improved for Brazil and India while remaining materially the same for Turkey. While after the 2013 announcement, manufacturing PMI indicated contraction across our subject countries, the post-hike manufacturing PMI has been buoyant and indicated expansion throughout since.
On the inflation front, Turkey has been suffering from very high rates of inflation for a while now, especially since the start of 2022. It is due to significantly high current account deficits, and unorthodox, and arguably counterintuitive policies implemented in the country. At Brazil, the inflation situation better with regards to Turkey, though higher commodity prices have
raised the general price level in the country too, while helping its exports value parallelly. India, despite facing higher inflation since the start of 2022, is better positioned given it much lower policy rate which grants its space to absorb excess liquidity without hurting much growth, as well as its achievement of its inflations targets it adopted in 2016.
In terms of reserves to GDP ratio, while Brazil has increased its ratio by about 50%, the improvement is attributable to a lower GDP value, while the unchanged ratio for Turkey masks the underlying shrinkage in both the GDP and reserves. India’s accumulation of reserves, further boosted since the onslaught of the pandemic, has been consistent and faster than the GDP growth rate, thus demonstrating an increase in reserve to GDP ratio.
Finally, only India’s market cap has increased meaningfully, and much faster than the underlying economic activity reflected in real GDP, indicating a deepening of the market as well as confidence among investors about prospects of the economy. Brazil’s market cap is has declined – the increased market cap to GDP ratio reflects a much smaller GDP, while Turkey’s market cap has declined at a faster pace than its GDP.
In conclusion, India has been prudent in managing its reserves since the last taper tantrum. Inflation, a major concern in the last taper tantrum has been majorly under control and within target band since. That inflation targets have been achieved while reducing policy rates at the same time is a very positive reflection of the RBI’s policies. Even in the COVID-19 period, inflation did not increase to very high levels. Another notable and significant distinction in India’s position in 2022 is its reserves position. Foreign exchange reserves have more than doubled since 2013, and today are sufficient to cover more than a year’s worth of imports (as compared to less than 8 months’ worth in 2013) and meet India’s short-term forex requirements 4 times over (as compared to 1.5 times in 2013). With respect to GDP, the forex reserves have improved from 16% in 2013 to 20% in 2022.
The Fed funds rate have increased by three percentage points in the last six months. This is alongside increasing changes in the macroeconomic scenario due to various disruptions in the post-COVID era. It still need to be observed how this effects the emerging economies throughout the world.
References:
1 Issing, Otmar. April 2010. The Development of Monetary Policy in the 20th Century – Some Reflections. President Centre for Financial Studies. (https://www.imf.org/external/np/seminars/eng/2011/res/pdf/oi2.pdf)
2 Bertaut, Carol, et al. October 2021. The International Role of the US Dollar. US Federal Reserve. (https://www.federalreserve.gov/econres/notes/feds-notes/the-international-role-of-the-u-s-dollar-20211006.htm)
3 US Federal Reserve FOMC Statement Transcript (https://www.federalreserve.gov/mediacenter/files/fomcpresconf20130619.pdf)
4 Rao, Sujata. August 2013. Emerging market sell-off worsens, more pain ahead. Reuters. (https://www.reuters.com/article/us-markets-emerging/emerging-market-sell-off-worsens-more-pain-ahead-idUSBRE97L0H220130822)
5 US Federal Reserve FOMC Minutes of the Meeting (https://www.federalreserve.gov/monetarypolicy/files/fomcminutes20211103.pdf)
6 Bank of International Settlement (https://www.bis.org/statistics/cbpol/cbpol_2208.xlsx)
7 World Bank (https://data.worldbank.org/indicator/FI.RES.TOTL.CD)
8 IMF Representative Exchange Rates (https://www.imf.org/external/np/fin/data/rms_mth.aspx?reportType=REP)
9 CEIC Database (https://insights.ceicdata.com/Untitled-insight/myseries
10CEIC Database (https://insights.ceicdata.com/Untitled-insight/myseries
11 CEIC Database (https://insights.ceicdata.com/Untitled-insight/myseries)